Chapter 1 Preliminaries: Installing R and RStudio
1.1 Introduction
Statistical analysis is the study of the properties of a dataset. There are different aspects of statistical analysis, and they often require that we work with data that are messy. According to Wickham and Grolemund (2016), computer-assisted data analysis includes the steps outlined in Figure ??.
First, the data are imported to a suitable software application. This can include data from primary sources (suppose that you collected coordinates using a GPS) or from secondary sources (the Census of Canada). Data will likely be text tables, or an Excel file, among other possible formats. Before data can be analyzed, they need to be tidied. This means that the data need to be arranged in such a way that they match the process that you are interested in. For instance, a travel survey can be organized so that each row is a traveler, or as an alternative so that each row is a trip.
Once that data are tidy, Exploratory Data Analysis (EDA) and/or its geographical extension Exploratory Spatial Data Analysis (ESDA) can be conducted. This involves transforming the raw data into information. Examples of transformations include calculating the mean and the standard deviation. Visualization is also part of this exploratory exercise. In EDA this could be creating a histogram or a scatterplot. Mapping is a key visualization technique in spatial statistics.
Modeling is a process that further extracts information from the data, typically by looking at relationships between multiple variables.
All of the tasks mentioned above, and many more, can be handled easily in a variety of software applications. For this course, you will use the statistical computing language R.
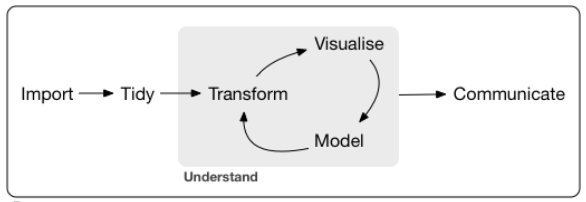
FIGURE 1.1: The process of doing data analysis (from Wickham and Grolemund, 2016)
1.2 Learning Objectives
In this reading, you will learn:
- How to install
R. - About the RStudio Interactive Development Environment.
- About packages in
R.
1.3 R: The Open Statistical Computing Project
1.3.1 What is R?
R is an open-source language for statistical computing. It was created by Ross Ihaka and Robert Gentleman at the University of Auckland, in New Zealand, as a way to offer their students an accessible, no-cost tool for their courses. R is now maintained by the R Development Core Team, and is developed by hundreds of contributors around the globe. R is an attractive alternative to other software applications for data analysis (e.g., Microsoft Excel, STATA) due to its open-source character (i.e., it is free), its flexibility, and large and dedicated user community. The presence of a very active community of developers and users, especially in an open context, means if there is something you want to do (for instance, linear regression), it is very likely that someone has already developed functionality for it in R.
A good way to think about R is as a core package, to which a library, consisting of additional packages, can be attached to increase its functionality. R can be downloaded for free at:
https://cran.rstudio.com/R comes with a built-in console (a user graphical interface), but better alternatives to the basic interface exist, including RStudio, an Integrated Development Environment, or IDE for short. RStudio can also be downloaded for free, by visiting the website:
https://www.rstudio.com/products/rstudio/download/R requires you to work using the command line, which is going to be unfamiliar to many of you accustomed to user-friendly graphical interfaces. Do not fear. People worked for a long time using the command line, or even more cumbersomely, using punched cards in early computers. Graphical user interfaces are convenient, but they have a major drawback, namely their inflexibility. A program that functions based on graphical user interfaces allows you to do only what is hard-coded in the user interface. Command line, as we will see, is somewhat more involved, but provides much more flexibility in operation, and it frees you from the constraints inherent in a point-and-click system.
Go ahead. Install R and RStudio in your computer. (If you are at McMaster working in the GIS lab, you will find that these have already been installed there).
Before introducing some basic functionality in R, lets quickly take a tour of the RStudio IDE.
1.3.2 The RStudio IDE
The RStudio IDE provides a very complete interface to interact with the language R, and do much more in addition. It consists of a window with several panes. Some panes include, in addition, several tabs. There are the usual drop-down menus for common operations, such as creating new files, saving, common commands for editing, etc. See Figure ?? below.
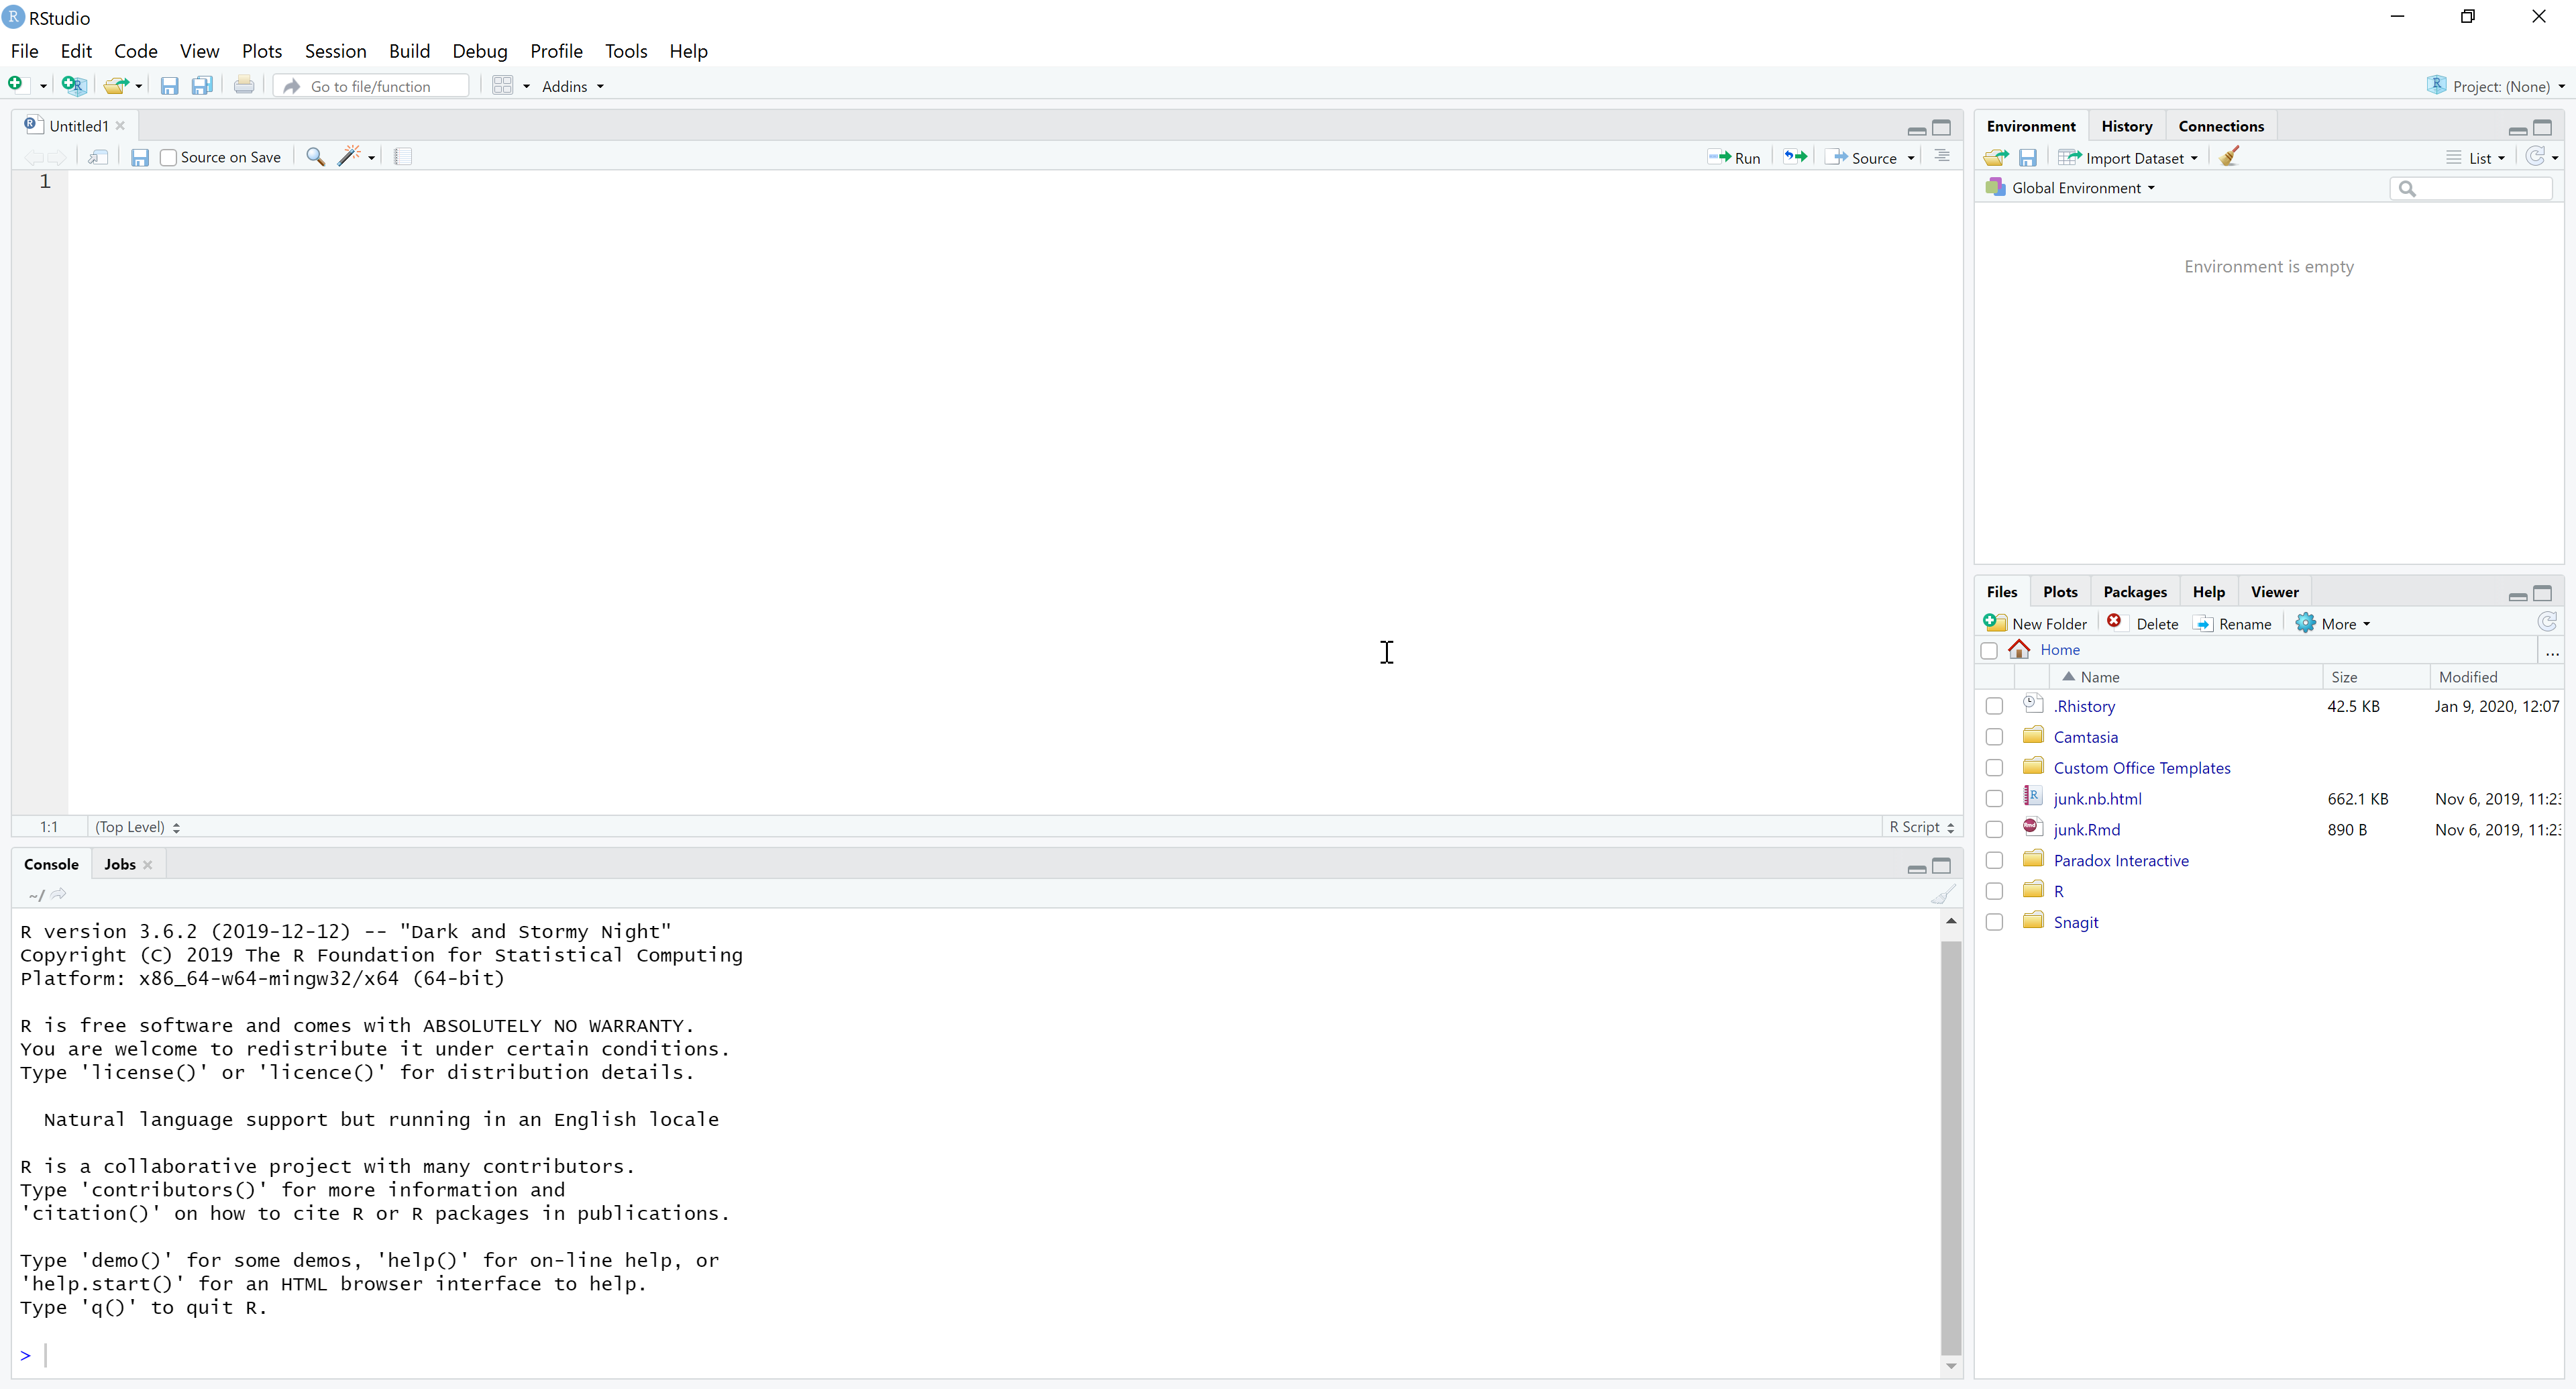
FIGURE 1.2: The RStudio IDE
The editor pane allows you to open and work with text and other files, where you can write instructions that can be passed on to the program. Writing something in the editor does not execute any instructions, it merely records them for possible future use. In fact, much of what is written in the editor will not be instructions, but rather comments, discussion, and other text that is useful to understand code.
The console pane is where instructions are passed on to the program. When an instruction is typed (or copied and pasted) there, R will understand that it needs to do something. The instructions must be written in a way that R understands, otherwise errors will occur. If you have typed instructions in the editor, you can use “ctrl-Enter” (in Windows) or “cmd-Enter” (in Mac) to send to the console and execute.
The environment is where all data that is currently in memory is reported. The History tab acts like a log: it keeps track of the instructions that have been executed in the console.
The last pane includes a number of useful tabs. The File tab allows you to navigate your computer, change the working directory, see what files are where, and so on. The Plot tab is where plots are rendered, when instructions require R to do so. The Packages tab allows you to manage packages, which as mentioned above, are pieces of code that can augment the functionality of R. The Help tab is where you can consult the documentation for functions/packages/see examples, and so on. The Viewer tab is for displaying local web content, for instance, to preview a Notebook (more on Notebooks soon).
This brief introduction should have allowed you to install both R and RStudio. The next thing that you will need is a library of packages.
1.4 Packages in R
According to Wickham (2015) packages are the basic units of reproducible code in the R multiverse. Packages allow a developer to create a self-contained unit of code that often is meant to achieve some task. For instance, there are packages in R that specialize in statistical techniques, such as cluster analysis, visualization, or data manipulation. Some packages can be miscellaneous tools, or contain mostly datasets. Packages are a very convenient way of maintaining code, data, and documentation, and also of sharing all these resources.
Packages can be obtained from different sources (including making them!). One of the reasons why R has become so successful is the relative facility with which packages can be distributed. A package that I use frequently is called tidyverse (Wickham 2017). The tidyverse is a collection of functions for data manipulation, analysis, and visualization. This package can be downloaded and installed in your personal library of R packages by using the function install.packages, as follows:
The function install.packages retrieves packages from the Comprehensive R Archive Network, or CRAN for short. CRAN is a collection of sites (accessible via the internet) that carry identical materials for distribution for R.
There are other ways of distributing packages. For instance, throughout this book you will make use of a package called isdas that contains a collection of datasets and functions used in the readings or activities. This package is not on CRAN, but instead can be obtained from GitHub, a repository and versioning system. To retrieve packages from GitHub you need a function called install_github, which in turn is part of the package devtools.
To download and install the package isdas, you need first to download and install devtools as follows:
Once that a package has been downloaded and installed, it needs to be loaded into a session to be available to use. I find it useful to think of packages that I download as “books” that I place in my personal “bookshelf”. Some “books” I obtain from the central library (i.e., CRAN), while others are shared by friends, and some I have even written myself. Once that the “books” are in my “bookshelf” they are part of my own personal library. This means that they are available for use. Next time I want to use a “book” from my library, I need to retrieve it from the bookshelf. This is similar to taking the book and opening it on my desk: now all the magic contained in the package is available for use!
Similarly, once that the book is in my library, I do not need to retrieve it again from the bookstore - a package, once installed, does not need to be installed again (it might need updates, but that is a different matter).
This analogy suggests that I can have many packages in my library, only some of which I may need at any specific time for a task. To retrieve a package (i.e., a book) from the library, so that we can use it, the function library is invoked as in this example:
This allows you to use all the functions in the package remotes. In particular, at this point you want to use a function that allows you to retrieve other packages! With the functionality of remotes::install_github you can download and install the companion package for the book by running the following instruction:
This will install the package (i.e., put it in your library) so that you can also benefit from its functionality.